Temperature Histogram
Traduction: [ Google | Babelfish ]
Catégories : [ Science ]
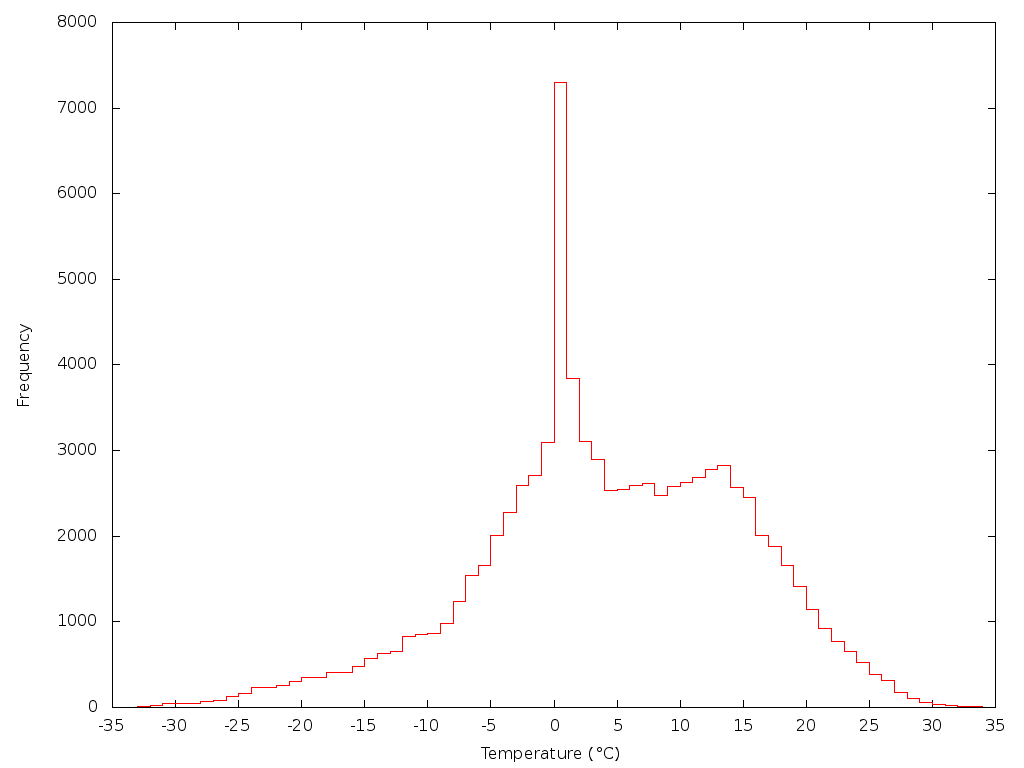
I have collected slightly over 10 years worth of hourly tempertature readings in Jyväskylä. The sources of temperature over the years have been the University of Jyväskylä's weather station, the METAR data for Jyväskylä's airport and the Finnish meteorological service which is currently being used; these services together were on average available 98.7% of the time.
The other day I wondered what a histogram of those values would look like, and here it is. The numbers have been rounded to the their closest integer values, and range from -35 °C to +34 °C. One disproportionately large peak large can be observed at 0 °C, probably due to melting ice/freezing water remaing in the sensor's surface and keeping it at exactly that temperature while the air around it would be slightly different (if you have a better explanation, don't hesitate to leave a comment!). Surprisingly, there is a second peak at 13 °C (explanations are welcome too!).
Finally, the average temperature is 4.0 °C, which is consistent wit the average minima (-1.4 °C) and maxima (7 °C) values given on Wikipedia's article about Jyväskylä.
[ Posté le 31 janvier 2012 à 22:54 | pas de commentaire | lien permanent ]